
Easy Apache Airflow alerts
Apache Airflow is an open-source platform for programmatically authoring, scheduling, and monitoring workflows. It allows you to create complex data pipelines that can be executed on a schedule, triggered by an event, or manually.
When self-hosting Airflow, it is crucial to keep track of what’s happening in your workflows to ensure everything is running smoothly. Without proper monitoring and alerting, it’s easy to miss critical issues that could cause your workflows to fail or produce incorrect results. These issues could be anything from a misconfigured task to a problem with your infrastructure or dependencies.
By setting up alerts, you can be notified of these issues as they happen, allowing you to quickly identify and resolve them. This can help minimize downtime and ensure that your workflows are always running as expected. In this article, we’ll explore how to set up alerts in Airflow so that you can stay on top of any issues that may arise.
Alerts we need to capture
There are several types of alerts that make sense to have when using Apache Airflow:
- DAG failure alerts: These alerts notify you when a DAG (Directed Acyclic Graph) fails to execute or encounters an error. This can be particularly important for critical workflows that need to be executed on a strict schedule.
- DAG planning failure alert: Notifies you when a DAG is not triggered within a specific timeframe, maybe because the whole instance is down or unresponsive or because of a misconfiguration.
- Task failure alerts: These alerts notify you when a specific task within a DAG fails to execute or encounters an error. This can help you identify the root cause of a problem more quickly and take appropriate action to resolve it.
- SLA (Service Level Agreement) alerts: These alerts notify you when a workflow is taking longer than expected to complete, based on its SLA. This can help you proactively address potential performance issues and ensure that your workflows are meeting their expected service levels.
- Data quality alerts: These alerts notify you when data quality issues are detected within your workflows, such as missing or incorrect data. This can help you identify and correct data issues more quickly, improving the overall quality of your data.
- Resource utilization alerts: These alerts notify you when your Airflow cluster is experiencing high resource utilization, such as CPU or memory usage. This can help you proactively manage your infrastructure and ensure that your workflows are running smoothly.
By setting up these types of alerts, you can ensure that you are proactively monitoring your workflows and quickly addressing any issues that arise, improving the overall reliability and performance of your data pipelines.
In this article, I will focus on the following alert types:
- DAG failure alerts
- DAG planning failure alert
- Task failure alerts
- SLA (Service Level Agreement) alerts
In my experience, it makes sense to monitor these on a 3rd party system, to ensure alert redundancy and that if the server hosting Apache Airflow is not available you will not miss any of them.
An easy-to-use scalable 3rd party solution
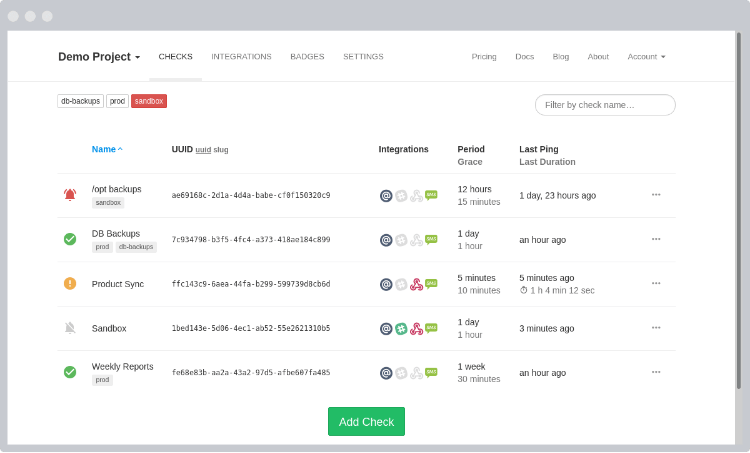
Ideally, you need to have an external dashboard that gives you the option to monitor scheduled tasks, see their execution history and alert you in case of an issue or in case a scheduled task is not completed in due time. This is where HealthChecks.io comes into play. It can offer all of the above, it is open-source and can be self-hosted but also available as a SAAS product with competitive pricing options.
It also comes with a simple-to-use API which makes it easy to integrate with Airflow.
Integrating Airflow with HealthChecks.io
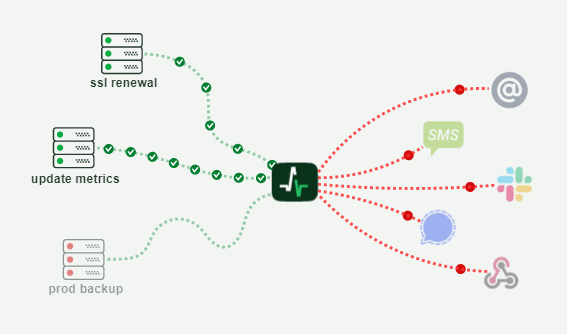
The end goal is to start sending “pings” from Airflow to HealthChecks.io when a DAG run completes. You can do this by using Airflow’s callback function (e.g. on_failure_callback, on_success_callback).
1. Create a new file with the name healthchecksio.py in the DAGS folder, under a subfolder called utils. Add the following Python source code to the new file:
import requests

# HealthChecks.io
# Simple and Effective Cron Job Monitoring
# Receive notifications when cron jobs or other scheduled tasks don't run on time

# Ping key can be found in the HealthChecks.io dashboard
PING_KEY: str = 'REPLACE-WITH-YOUR-HEALTHCHECKS.IO-PINGKEY'

def fail_alert(context) -> None:
    task_instance = context.get('task_instance')
    dag_id = task_instance.dag_id.lower()

    url = 'https://hc-ping.com/' + PING_KEY + '/' + dag_id + '/fail'

    try:
        requests.get (url, timeout=50.0)
    except:
        print("HealthChecks.io exception occurred when sending fail alert for " + dag_id)


def success_alert(context):
    task_instance = context.get('task_instance')
    dag_id = task_instance.dag_id.lower()

    url = 'https://hc-ping.com/' + PING_KEY + '/' + dag_id

    try:
        requests.get (url, timeout=50.0)
    except:
        print("HealthChecks.io exception occurred when sending success alert for " + dag_id)
2. Create 1 more new file under the utils subfolder with the name alerts.py and the following python source code:
from utils import  healthchecksio

def failure(context) -> None:
    healthchecksio.fail_alert(context)

def success(context) -> None:
    healthchecksio.success_alert(context)
3. Go to every DAG you want to enable alerts for and add the following at the beginning of the DAG source code:
from utils import alerts
and the following 2 lines of source code where you define the DAG:
    on_failure_callback = alerts.failure,
    on_success_callback = alerts.success
This way you are now sending a ping to HealthChecks.io for every DAG success and failure with the name of the DAG in the ping URL.
4. Next step is to set up alerts for the DAGs you actually want to track in HealthChecks.io. You log in to Healthchecks. Create a “New Check” and follow the instructions below to set it up:
- Use the name of the DAG as the name of the check
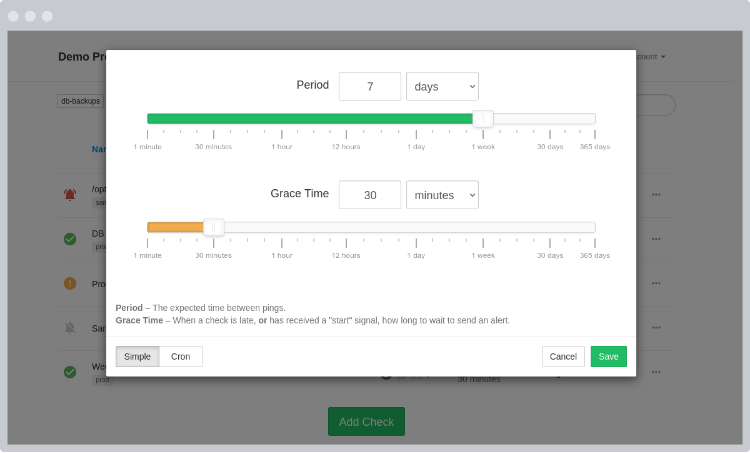
- Copy the DAG’s CRON schedule to the check
- Set a grace time, that will be the maximum delay allowed before triggering a notification
- Add any tags if you want to group checks together
After you create the check you can also add notification channels that will be alerted when a failure or success takes place.
And that’s it! You can follow the same steps to add alerts for more DAGs just by adding more checks to HealthChecks.io. By default, all of your DAGs will send a ping to the service if you add the source code under step #3 for all of your DAGs (At least this is the approach I follow, so I can manage everything within HealthChecks, without the need to update any files).
