How to measure CTR for each website element
Modern websites are using several elements (e.g. banners, forms, internal search, carousels, 3D views – this list can go on forever) and long vertical pages. This makes it difficult to understand which parts of the website are used more often and identify the reason why some of them are under-performing. This implementation will help create a report in Adobe Analytics (Omniture), showing which website elements have a higher click through rate, but will also allow you to identify lower CTR elements which might not even be “visible” to the user because of their position in the page.
Using 3 custom variables (2 list variables and 1 traffic variable) we are going to capture website element names every time they are part of a loaded page (stored in the 1st list variable), every time they were viewed by the visitor (stored in the 2nd list variable) and every time the visitor interacts with them (traffic variable).
First we define a list of element names, which need to be tracked and start monitoring them on every page load, page resize, scroll and mouse click. Using the captured data, we can create a report showing how many times a specific element was part of a loaded page, if it was actually viewed by the visitor and if the visitor interacted with it.
How do I implement this?
We will start by finding a way to identify website elements. An easy way to do this is using the “id” attribute of the HTML elements we would like to track. For the elements you want to track, you are going to create a list of element “id” attribute values (an elements pool).
Using this pool of element ID values, you will need to monitor these id values:
1) On every page load
For every element in the pool appearing in the page, we will add its “id” attribute in a cookie called “elementsLoaded”. This cookie will always store all element ID values that were part of every loaded page, separated by commas.
2) Every time the visitor scrolls or resizes the page
In case any of the elements in the pool, are inside the visitor’s updated viewport, we will add their “id” value in a cookie called “elementsViewed”. For this step we should also avoid duplicates, so make sure that every element id you add to the cookie is not already part of it. In the final cookie, all the id values, are separated by commas (similar to step #1).
3) Every time the visitor clicks on a link / form button
If the element clicked belongs (is a descendant) of an element in the pool, we capture the id of the parent element in a cookie called “elementClicked”.
4) Next step is to look for these cookies on every page load and use them to populate each one of the custom variables.
The first 2 list variables will be populated with the values of the “elementsLoaded” and “elementsViewed” cookies (which are comma separated values). Make sure to set the 2 list values to use the comma character as a separator, when setting up the variables in Adobe Analytics.
The custom traffic variable will be populated with the value of the “elementClicked” cookie, which is always going to be a unique value.
Finally you can create a report, using all 3 variables, and evaluate how many times every element was:
- part of a loaded page
- actually viewed by the visitor
- clicked by the visitor, to navigate to a new page
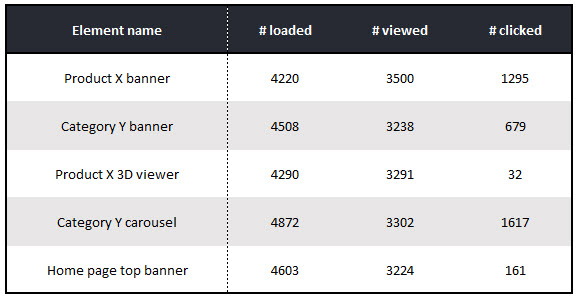
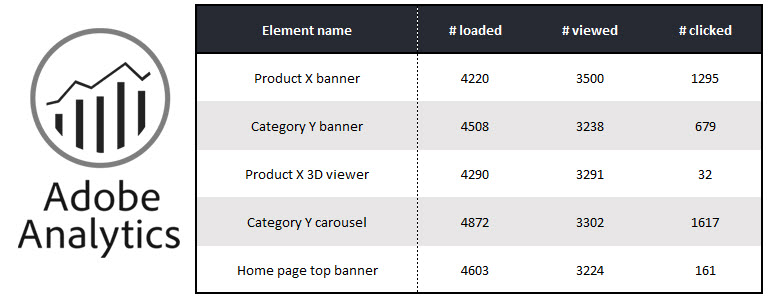
You will not be able to combine all 3 dimensions in Adobe Analytics but you can easily create a report in Excel using a Vlookup function. The final table will look like the following example:

UPDATE:
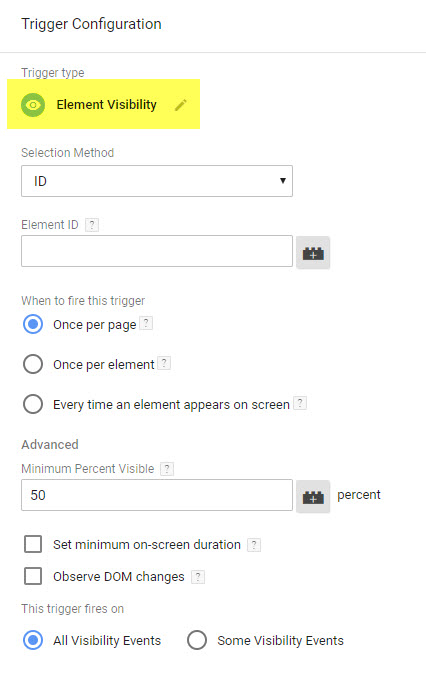
If you are using Google Tag Manager, the implementation process is much easier. GTM offers a trigger allowing you to easily setup the rules for each element you want to track:


